


Crowning the Best Scrum in Club Rugby
The subjectively objective proof of the unprovable.


Scrums stats are flawed. The majority of a team’s scrum stats only consider scrums on their own put in. Therefore, if they are getting totally destroyed on opposition put it, it doesn’t show up in their stats.
Furthermore, we see that referees are often keen to protect clean ball, willing to play on so long as the ball gets to the number 8’s feet, regardless of what happens in the front rows. This also protects the stats of the less dominant teams.
Nonetheless, scrum stats do exist which means we have something to analyse. Amongst them, we can find trends and take learnings. We are also able to name the side who are, statistically, the best scrummaging club team in the world.
Styles of Scrums
Let’s start off with a data set. Generally speaking, a team is trying to do one of two things at scrum time: be clean and create a platform to launch an attack/exit or be aggressive and win a penalty, therefore gaining territory.
If we take scrum completion percentage to be a measure of cleanliness and take the likelihood of the scrums resulting in a penalty to be a measure of aggression, we can plot the two against each other for all 51 clubs across Super Rugby, URC, TOP14 and Premiership and come up with a graph such as below.
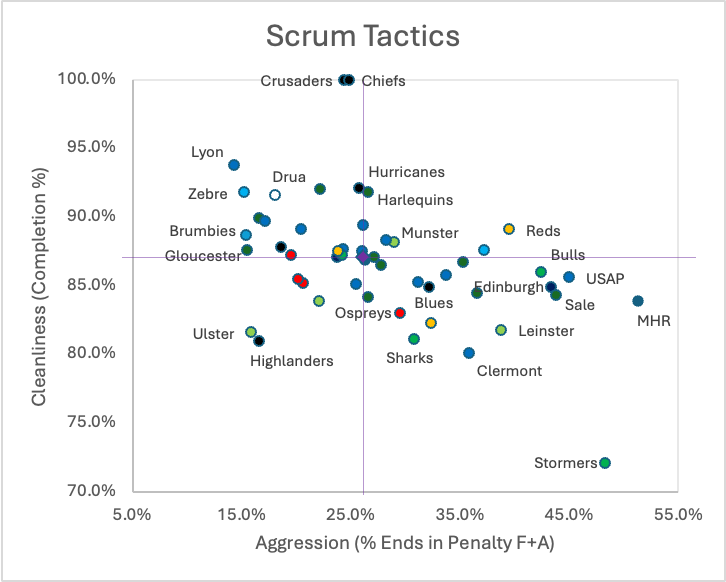
The hypothesis holds up: in most cases, the more aggressive a scrum is, the less clean it is. Teams make a strategic choice of what kind of scrum they want to have and employ various tactics to achieve the outcome they desire.
Scrums, of course, are like tangos: they take two. Your scrum cleanliness can be ruined by a particularly unclean opposition. However, over the course of a season, the trends do start to emerge and enable us to say who is clean and who is not.
But it does not tell us best or worst. We need to start applying more measure to whittle down the contenders and crown an eventual champion.
Elimination Rounds
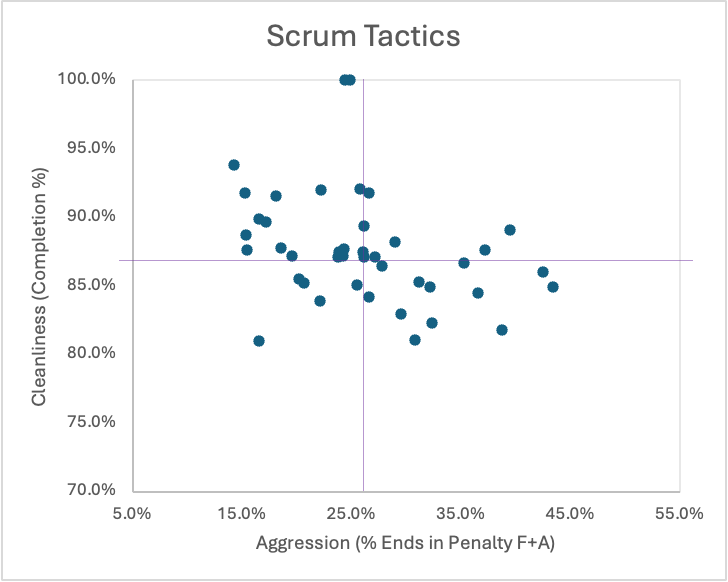
Let’s take out the bottom 10 clubs for scrum success. If the scrum is not successful then it cannot be a good one. This knocks out a few outliers such as the Stormers and Clermont but doesn’t change the shape of the graph too much.
Next we can take out the scrums which concede a higher than median average number of penalties. To concede a penalty on your own put in is a costly mistake as it not only gives up an attacking platform but gifts one to the opposition.

By doing this we eliminate a number of teams on the right-hand side of the graph. This shows that aggressive scrums which look to win penalties are also often the ones that give away lots of penalties too.
This leads us to question how those teams win their penalties. We have all heard about the dark arts at scrum time; all cried foul at the scrummaging angles of the likes of Andrew Porter and Nicky Smith. Some days their tricks work, other days they do not. It all comes down to the interpretation of the referee.
The very best scrums should be able to win the ball on opposition put in. This represents a huge bonus for a team as it regains possession and takes away an opponent’s platform. Taking away any team who is in the bottom 10 for opposition scrums won gives us the below:

This time, we have taken more points away from the left-hand side of the graph. This suggests that teams who prioritise the completion of scrums are less able to affect turnovers in that area.
Interestingly, the team that is the best at winning opposition scrums is Montpellier who win an incredible 23% of opposition feeds. However, they have already been eliminated in our analysis due how many penalties they give away, ranking in the top 10 for that metric, and their overall scrum success, for which they rank in the bottom 10. Once again, we see that scrums are about risk vs reward: by trying to gain more you may lose what you have.
Finally, we should reward the remaining teams that are very good at winning penalties, eliminating any who are below the median average for penalties won. Naturally, this again penalises teams on the left-hand side of the graph. Toulouse and Bristol are the only ‘aggressive’ teams that lose out in this instance.

The Final Contenders
We are now left with 10 teams, which feels a good number to be going on with. All of these teams are above average at winning penalties and winning turnovers at the scrum without giving away too many penalties or having a poor overall success.
The final part of our statistical analysis is to rank the efficacy of these scrums. We do this by adding together their scrum success and their likelihood of turnover. If we set the baseline at 100%, this will tell us which scrums are a net positive in games and which are a net negative.

Reassuringly, all of our 10 finalists are a net positive. We also have two clear leaders: the Chiefs and the Bulls. At time of writing these teams rank 1st in Super Rugby and 3rd in the URC respectively, which is also reassuring.
So, with an efficacy 8% better than anyone else, are the Chiefs our champions? Well, this is where we have to get subjective.
The Chiefs have only played half the umber of games of the Bulls (7 vs 14) and are yet to play the Waratahs, the only other Super Rugby team among our finalists. They have twice played against the Blues who were eliminated early on, thanks to the number of penalties they concede.
The Bulls, on the other hand, have not only played twice the number of games of the Chiefs but they have already scrummed against fellow finalists Benetton and Edinburgh, whilst being set to scrum against Glasgow and Munster in the next two rounds of URC.
The analysis we have done ranks the URC as the strongest scrummaging league in pro rugby and the Bulls as the strongest scrummaging team in that league. Hence, we crown them the scrum champions. They have the best stats across the board with the fewest caveats.
They are also South African, which sounds right.
Bonus: Can a Scrum Be Evil?
Here’s a video from the membership page of my YouTube channel (access for 99p per month) exploring the scrum stats of a particular club ad the dark twist at the end…
Thanks for reading! This Substack is where you can get all my women’s rugby content, such as this clip exploring the success of Spain: